


Wholesale energy markets are responsible for matching the supply and demand of electricity on the grid at all times and at the lowest possible cost. Grid operators employ a variety of market and pricing methodologies in their quest to balance supply and demand, and at times, these methods can create significant volatility for power producers in these markets. To maximize market revenue, participants in these markets must track and anticipate this volatility. While all participants in Regional Transmission Organizations/Independent System Operators (RTO/ISO) markets need to manage volatility risk, it is especially important for those bidding energy storage assets, due to the nature in which these assets procure and deliver energy.
In this blog, we discuss some of the reasons for high price volatility, specifically in the Electric Reliability Council of Texas (ERCOT) market. We also explore how digital solutions like Fluence Mosaic™ can help power producers accurately forecast market changes to reduce risk, increase revenues, and reliably deliver power when this high volatility presents itself due to grid conditions.

Price Volatility Has Many Drivers
In the beginning of each season, ERCOT releases its Seasonal Assessment of Resource Adequacy (SARA) report which reviews and estimates whether the projected level of power supply will adequately fulfill the expected highest level of electricity demand. This report is used to predict any potential risks of deploying an Energy Emergency Alert Level 1 (EEA1), a comprehensive contingency plan for when operating reserves reach below 2,300 MW with no possibility of recovering within a 30-minute time frame, during periods of high demand. Once ERCOT triggers an EEA1, the market is designed to tap into alternative power reserves to restore the normal function of reliable electricity during that time.
In a recent SARA study (October 2022), ERCOT studied four of the more likely scenarios based on previous system conditions where they have experienced potential periods of high volatility:
- Scenario 1: Normal levels of load and wind generation;
- Scenario 2: High levels of peak electricity load;
- Scenario 3: Low levels of wind generation; and
- Scenario 4: Simultaneous occurrence of high-peak load and low-wind generation.
High volatility in the market typically results in higher prices for power buyers. During a typical summer peak day (Scenario 1), the top simulated hourly wholesale electricity price reaches $90/MWh. However, in a high-peak scenario (Scenario 2), prices spike by 17 percent to $105/MWh. If there is low wind and normal demand (Scenario 3), the highest price shoots up to $709/MWh. In the fourth scenario, when high peak load coincides with low wind generation, the electricity price skyrockets to over $2,900/MWh.
Figure 1: Short-Term Integrated Forecasting System simulation of the Electric Reliability Council of Texas (ERCOT) power market
Data source: U.S. Energy Information Administration, Note: Scarcity adder represents the value of additional resources to grid reliability.
A key component of defining the scenarios above is the continued increase in wind power in the ERCOT market. According to ERCOT’s 2023 Fact Sheet, wind generation accounts for 29 percent of the installed generation capacity for 2023 and provided an average of 25 percent of the generation in the ERCOT market. Additionally, ERCOT has experienced wind penetration of over 69 percent in its daily operations.
Figure 2: 2022 Energy Use
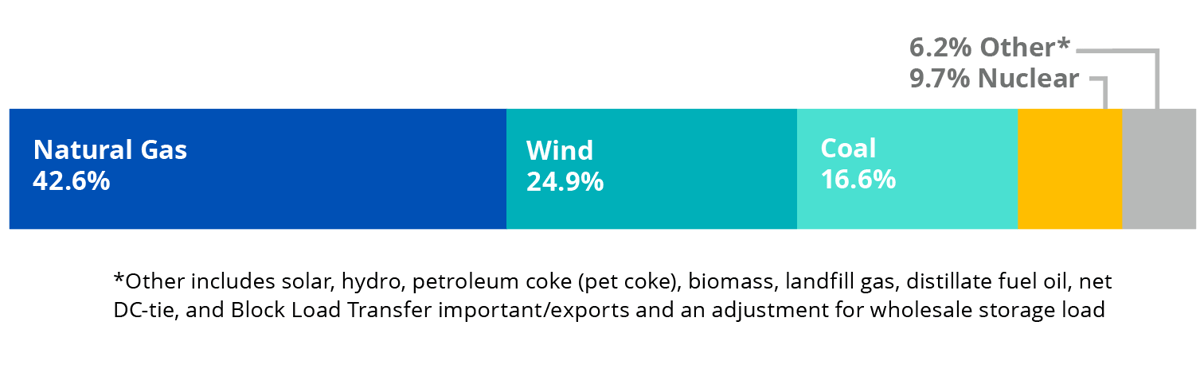
Data source: ERCOT March 2023 Fact Sheet
In terms of actual energy usage for meeting demand, wind makes up 24 percent, coming in second place to the primary fossil fuel source of natural gas. As wind generation decreases, a wind generator’s capacity factor (the percentage of capacity available relative to nameplate generation capability) also decreases, requiring other dispatchable sources of generation to make up the difference. Typically, this difference is made up by natural gas generators. Since natural gas plants have higher fuel costs compared to wind generators (which have no fuel cost), the result is an increase in electricity prices. This pattern is especially prevalent during the summer season, often between the months of July and August. The effect of changes in peak electricity demand and fluctuations in wind availability and the resulting potential for higher scarcity pricing can lead to temporary spikes in the ERCOT market’s prices.

Accurate Forecasting Matters
The resulting increased volatility in electricity prices presents a challenge to power providers seeking to maximize revenue. Depending on the complexity and movement of the market, power suppliers can experience higher risks, ultimately causing a loss in revenue. Understanding the fluctuations of price at certain points on the grid is key to preventing this – this is where accurate forecasting matters most.
The four scenario types mentioned above show why specific prices for electricity are paid at each location or node on the grid. This also varies depending on the loading levels on the transmission lines that connect the nodes. In cases of transmission congestion, Locational Marginal Prices (LMPs) typically peak at nodes situated in the North load zone of ERCOT, where electricity demand is at its highest, particularly in and around the Dallas-Fort Worth region. The LMPs in the West load zone tend to be lower because this area experiences less demand, has considerable wind-generating capabilities, and is part of a general area of economic congestion in moving power from the West to the East.
Figure 3: simulated peak-hour ERCOT LMPs at all ERCOT pricing nodes
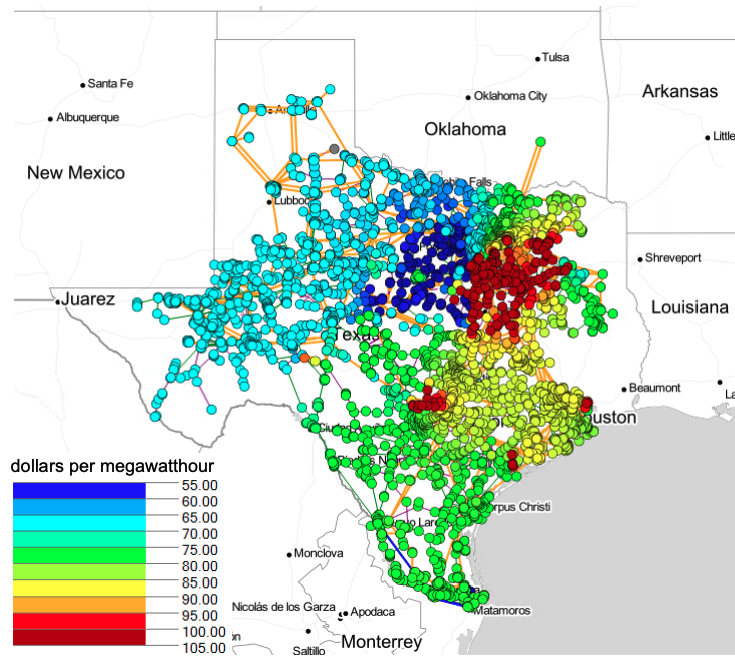
Data Source: U.S. Energy Information Administration Short Term Integrated Forecasting System and LCG Consulting
Note: Prices in map are for the hour with the highest system energy price.
Displayed in the simulation above, the ERCOT system energy price surges to a maximum of $90/MWh. During this period, the simulated load-weighted LMP in the North zone of ERCOT averages $102/MWh. This zone exhibits the most extensive range of nodal prices, with an equal number of nodes having LMPs below $60/MWh as those with LMPs exceeding $100/MWh. Nevertheless, most of the load in the North zone is concentrated in the higher-priced nodes. In the West zone, the load-weighted average price settles at $68/MWh, with over 90 percent of the nodes in this zone having LMPs between $60/MWh and $70/MWh. In an extreme scenario with peak load and low-wind generation, scarcity pricing changes this pattern significantly and the lowest regional prices occur in the Houston load zone with an average price of $2,742/MWh and nearly all nodes with an LMP less than $2,800.
Figure 4: Extreme case: Simulated peak-hour ERCOT LMP at nodes
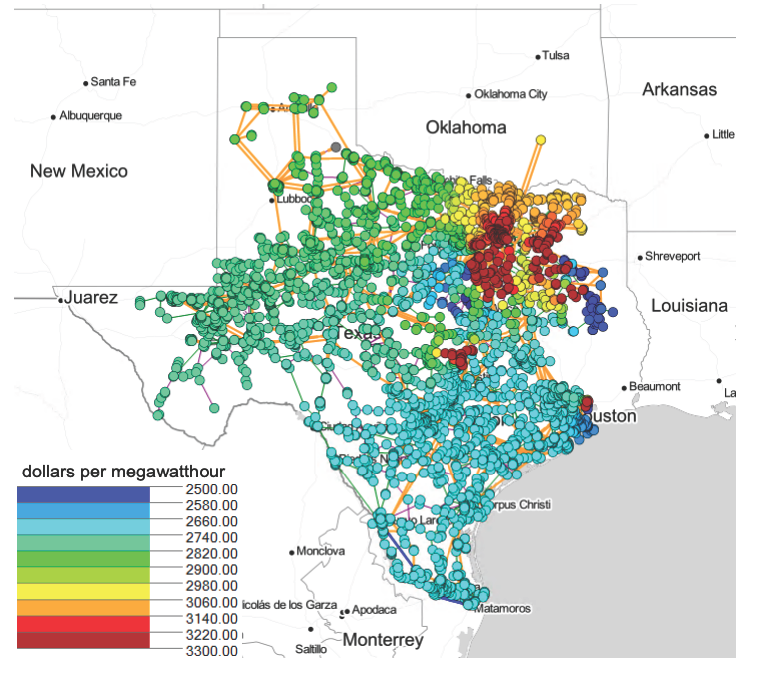
Data Source: U.S. Energy Information Administration Short Term Integrated Forecasting System and LCG Consulting
Note: Prices in map are for the hour with the highest system energy price.
As these four high level scenarios demonstrate, ERCOT prices can, at times, be very volatile. These scenarios touch on two variables in the equation for energy pricing: wind generation and demand. However, there are many additional variables that can influence the volatility of energy prices. Transmission outages, generation outages, and renewable generation forecasting errors are just a few of the other variables that will swing prices higher and lower depending upon geographic location within ERCOT. To maximize revenue potential for power producers, particularly energy storage assets that arbitrage pricing differences in the market, an accurate forecast of the realized energy prices in ERCOT is of the utmost importance.
AI Software Enables Accurate Forecasting and Helps Manage Price Volatility During Peak Demand
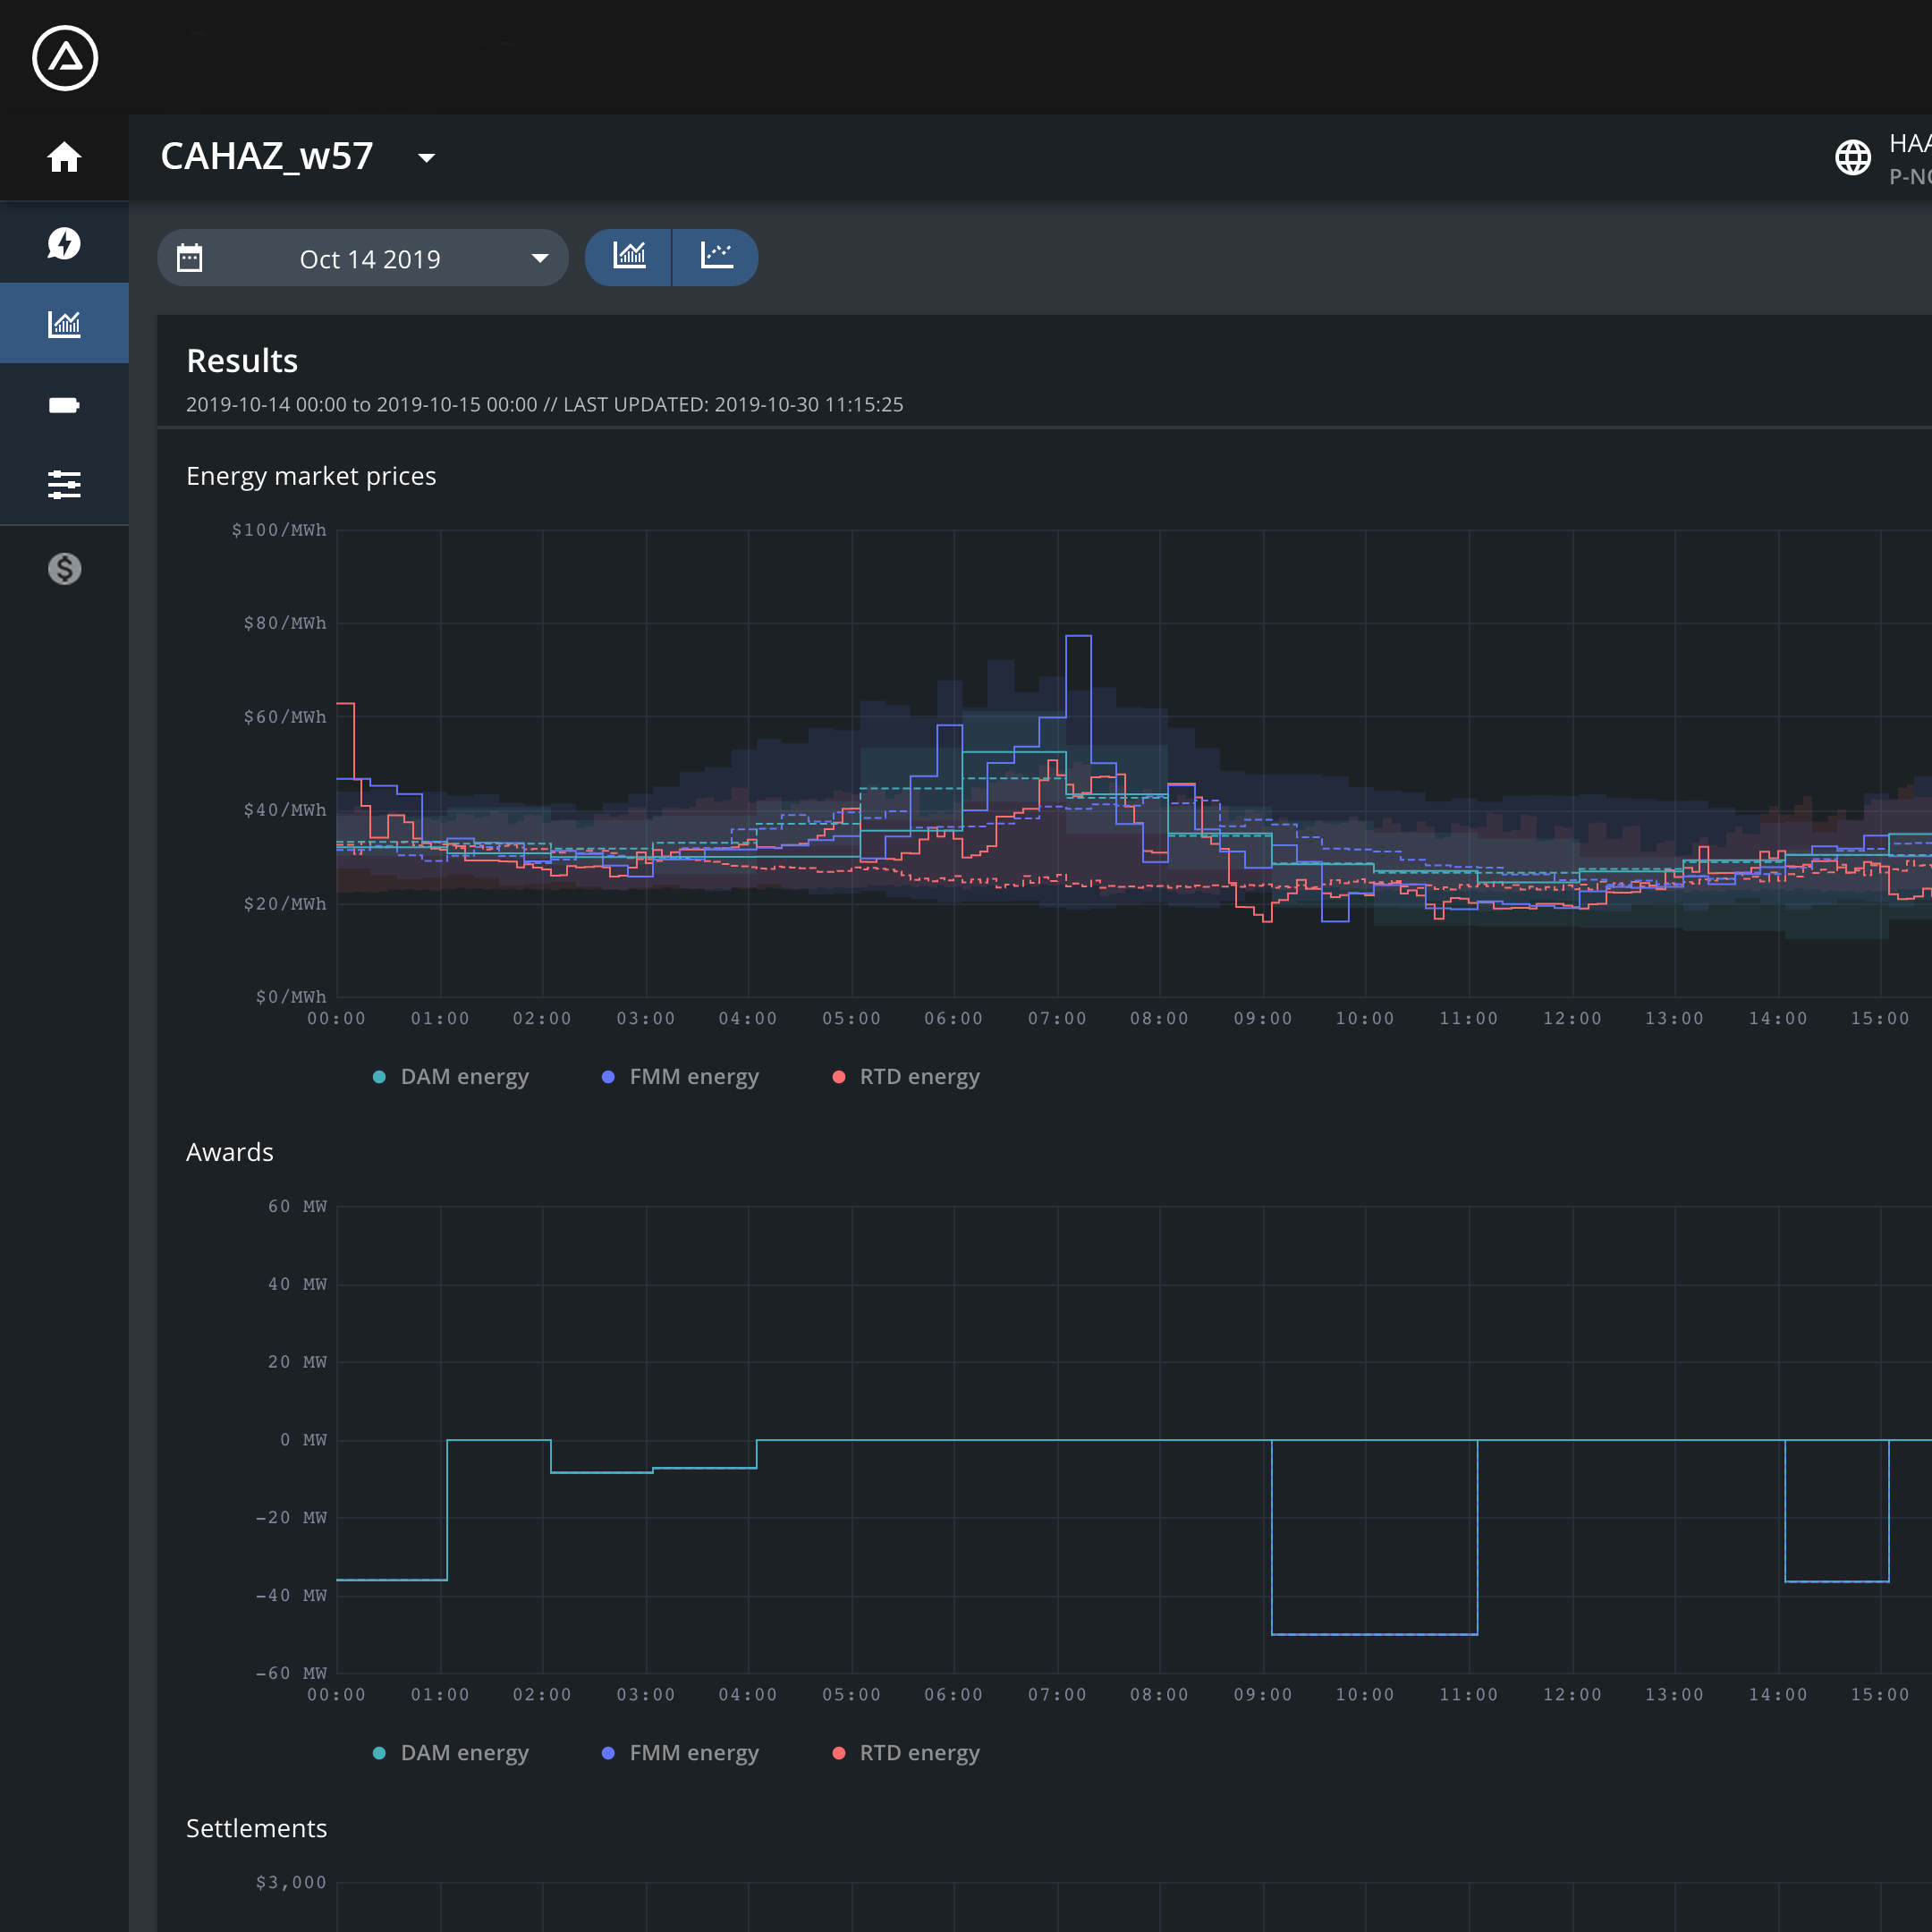
An accurate forecast of nodal energy prices, both in the Day-Ahead Market and Real-Time Markets, critically impacts revenue generation for energy storage assets. Ensuring that the energy storage asset is buying power, producing power, and providing the needed ancillary services for the operation of the grid can significantly increase the revenue potential for the asset.
In the short term, as ERCOT and the grid continue to transition to cleaner, renewable energy options, energy price volatility will continue to increase. Due to the large number of drivers of price volatility and the complicated interactions between those drivers, power producers require powerful and flexible computational tools to learn the patterns of price volatility on the grid and then project those patterns into the future. This is where AI-based price forecasts come in. In conjunction with advanced mathematical optimization models, AI can ensure that power producers can manage volatility risk and maximize revenue as a result. AI-based forecasting and optimization are needed more than ever to ensure revenue-positive operations for an energy storage asset.
Mosaic, our intelligent bidding software for renewables and storage assets, automates wholesale market participation, including energy price forecasting. With up to 95% perfect foresight (near-perfect prediction of market prices for the next 24 hours), Mosaic equips power providers with machine-learning algorithms that can successfully navigate volatile energy markets like ERCOT.
What if your energy storage asset bidding were optimized by AI?

Developing models that employ different machine learning techniques, studying the effects of wind penetration/load location at the system level, zonal level, and nodal level, as well as navigating the wide range of potential impacts from inputs like demand curves, wind forecast, load forecast, generation availability (both nodally and zonally) are ways that Fluence ensures the Mosaic platform can provide the needed forecast accuracy. The cloud-based platform is a powerful tool designed to help asset owners make better, more informed operating decisions while maximizing the value of their assets. As energy market complexities continue to grow, AI-enabled resources like Mosaic can fill in the gap for quick, accurate forecasting and in-depth market analyses, producing better outcomes for power suppliers and their customers.
Forward-Looking Statements
Any statements that are not historical facts and that express, or involve discussions as to, Fluence’s expectations, beliefs, plans, objectives, assumptions, future events or the performance or safety of new technology and products (often, but not always, indicated through the use of words or phrases such as “will likely result,” “are expected to,” “will continue,” “is anticipated,” “estimated,” “intends,” “plans,” “believes” and “projects”) may be forward-looking and may involve estimates and uncertainties which could cause Fluence’s actual results to differ materially from those expressed in the forward-looking statements. Such forward-looking statements are subject to a number of assumptions, risks, and uncertainties, including those described under the heading “Risk Factors” in Fluence’s most recent Annual Report on Form 10-K and in other filings Fluence makes with the SEC. New factors emerge from time to time, and it is not possible for us to predict all such factors. Further, we cannot assess the impact of each such factor on our results of operations or the extent to which any factor, or combination of factors, may cause actual results to differ materially from those contained in any forward-looking statements. Any forward-looking statements speak only as of the date of the blog and are based on information available to Fluence as of the date of such publication and Fluence does not undertake to update or revise any of the forward-looking statements, whether as a result of new information, future events or otherwise.