


This blog post was originally posted by AMS, which was acquired by Fluence in October 2020.
How to evaluate bid optimization solutions for grid-connected battery storage
California is proving yet again to be a hotbed of energy innovation. With more than 2 GW of new utility-scale battery storage coming online in the next 12 months—a nearly 10x capacity increase from the roughly 275 MW[1] installed today—California battery asset owners and operators are facing unprecedented challenges.
Traditional approaches for bidding thermal assets (e.g. based on marginal cost derived from fuel cost and heat rates) or renewables (e.g. based on marginal cost derived from REC value) are not viable for fast ramping, use-limited battery resources. In order to maximize asset revenue, operators must determine when to charge vs. discharge, manage battery state of energy (SOE), navigate day-ahead and real-time forecasts, and comply with CAISO’s Non-Generator Resource[2] (NGR) rules.
Legacy manual and spreadsheet-based approaches used to bid conventional energy assets will be not meet the challenges posed by battery storage assets. To meet this new market need, a new class of software based, algorithmic bidding solutions is fast emerging.
The technical evaluation of algorithmic bidding software platforms is rapidly becoming a critical competency for companies seeking to build and operate dynamic energy assets like battery storage. In order to be successful in this evaluation, asset owners should consider two primary metrics: (1) Revenue uplift (e.g. relative to a human-centric trading strategy) and (2) Percent of Perfect Foresight, or PoP.
Revenue Uplift
Revenue uplift measures the additional revenue an asset can achieve using an optimized bidding approach, relative to an alternative bidding approach. A revenue uplift analysis allows asset owners to quantify the market value of an algorithmic bidding strategy compared to that of a manual bidding approach for their planned or existing battery storage system. To control for seasonality and volatile market conditions, revenue uplift is calculated by running two scenarios of a year-long backcast[3] using (1) an algorithmic bidding strategy and (2) a manual bidding approach. Each scenario in the analysis simulates performance using specific asset characteristics (e.g. warranty constraints) and actual market price data. Comparing the resulting backcasted revenue of the two scenarios shows asset owners how much value is being left on the table with a manual bidding approach.
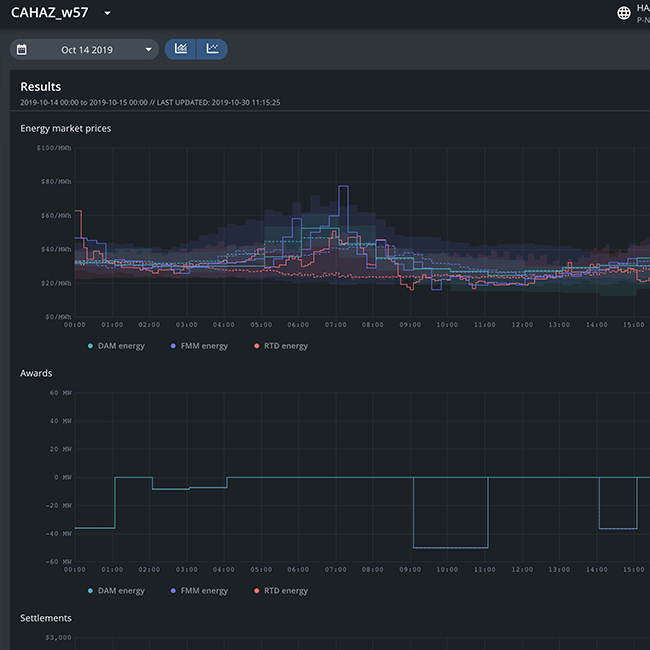
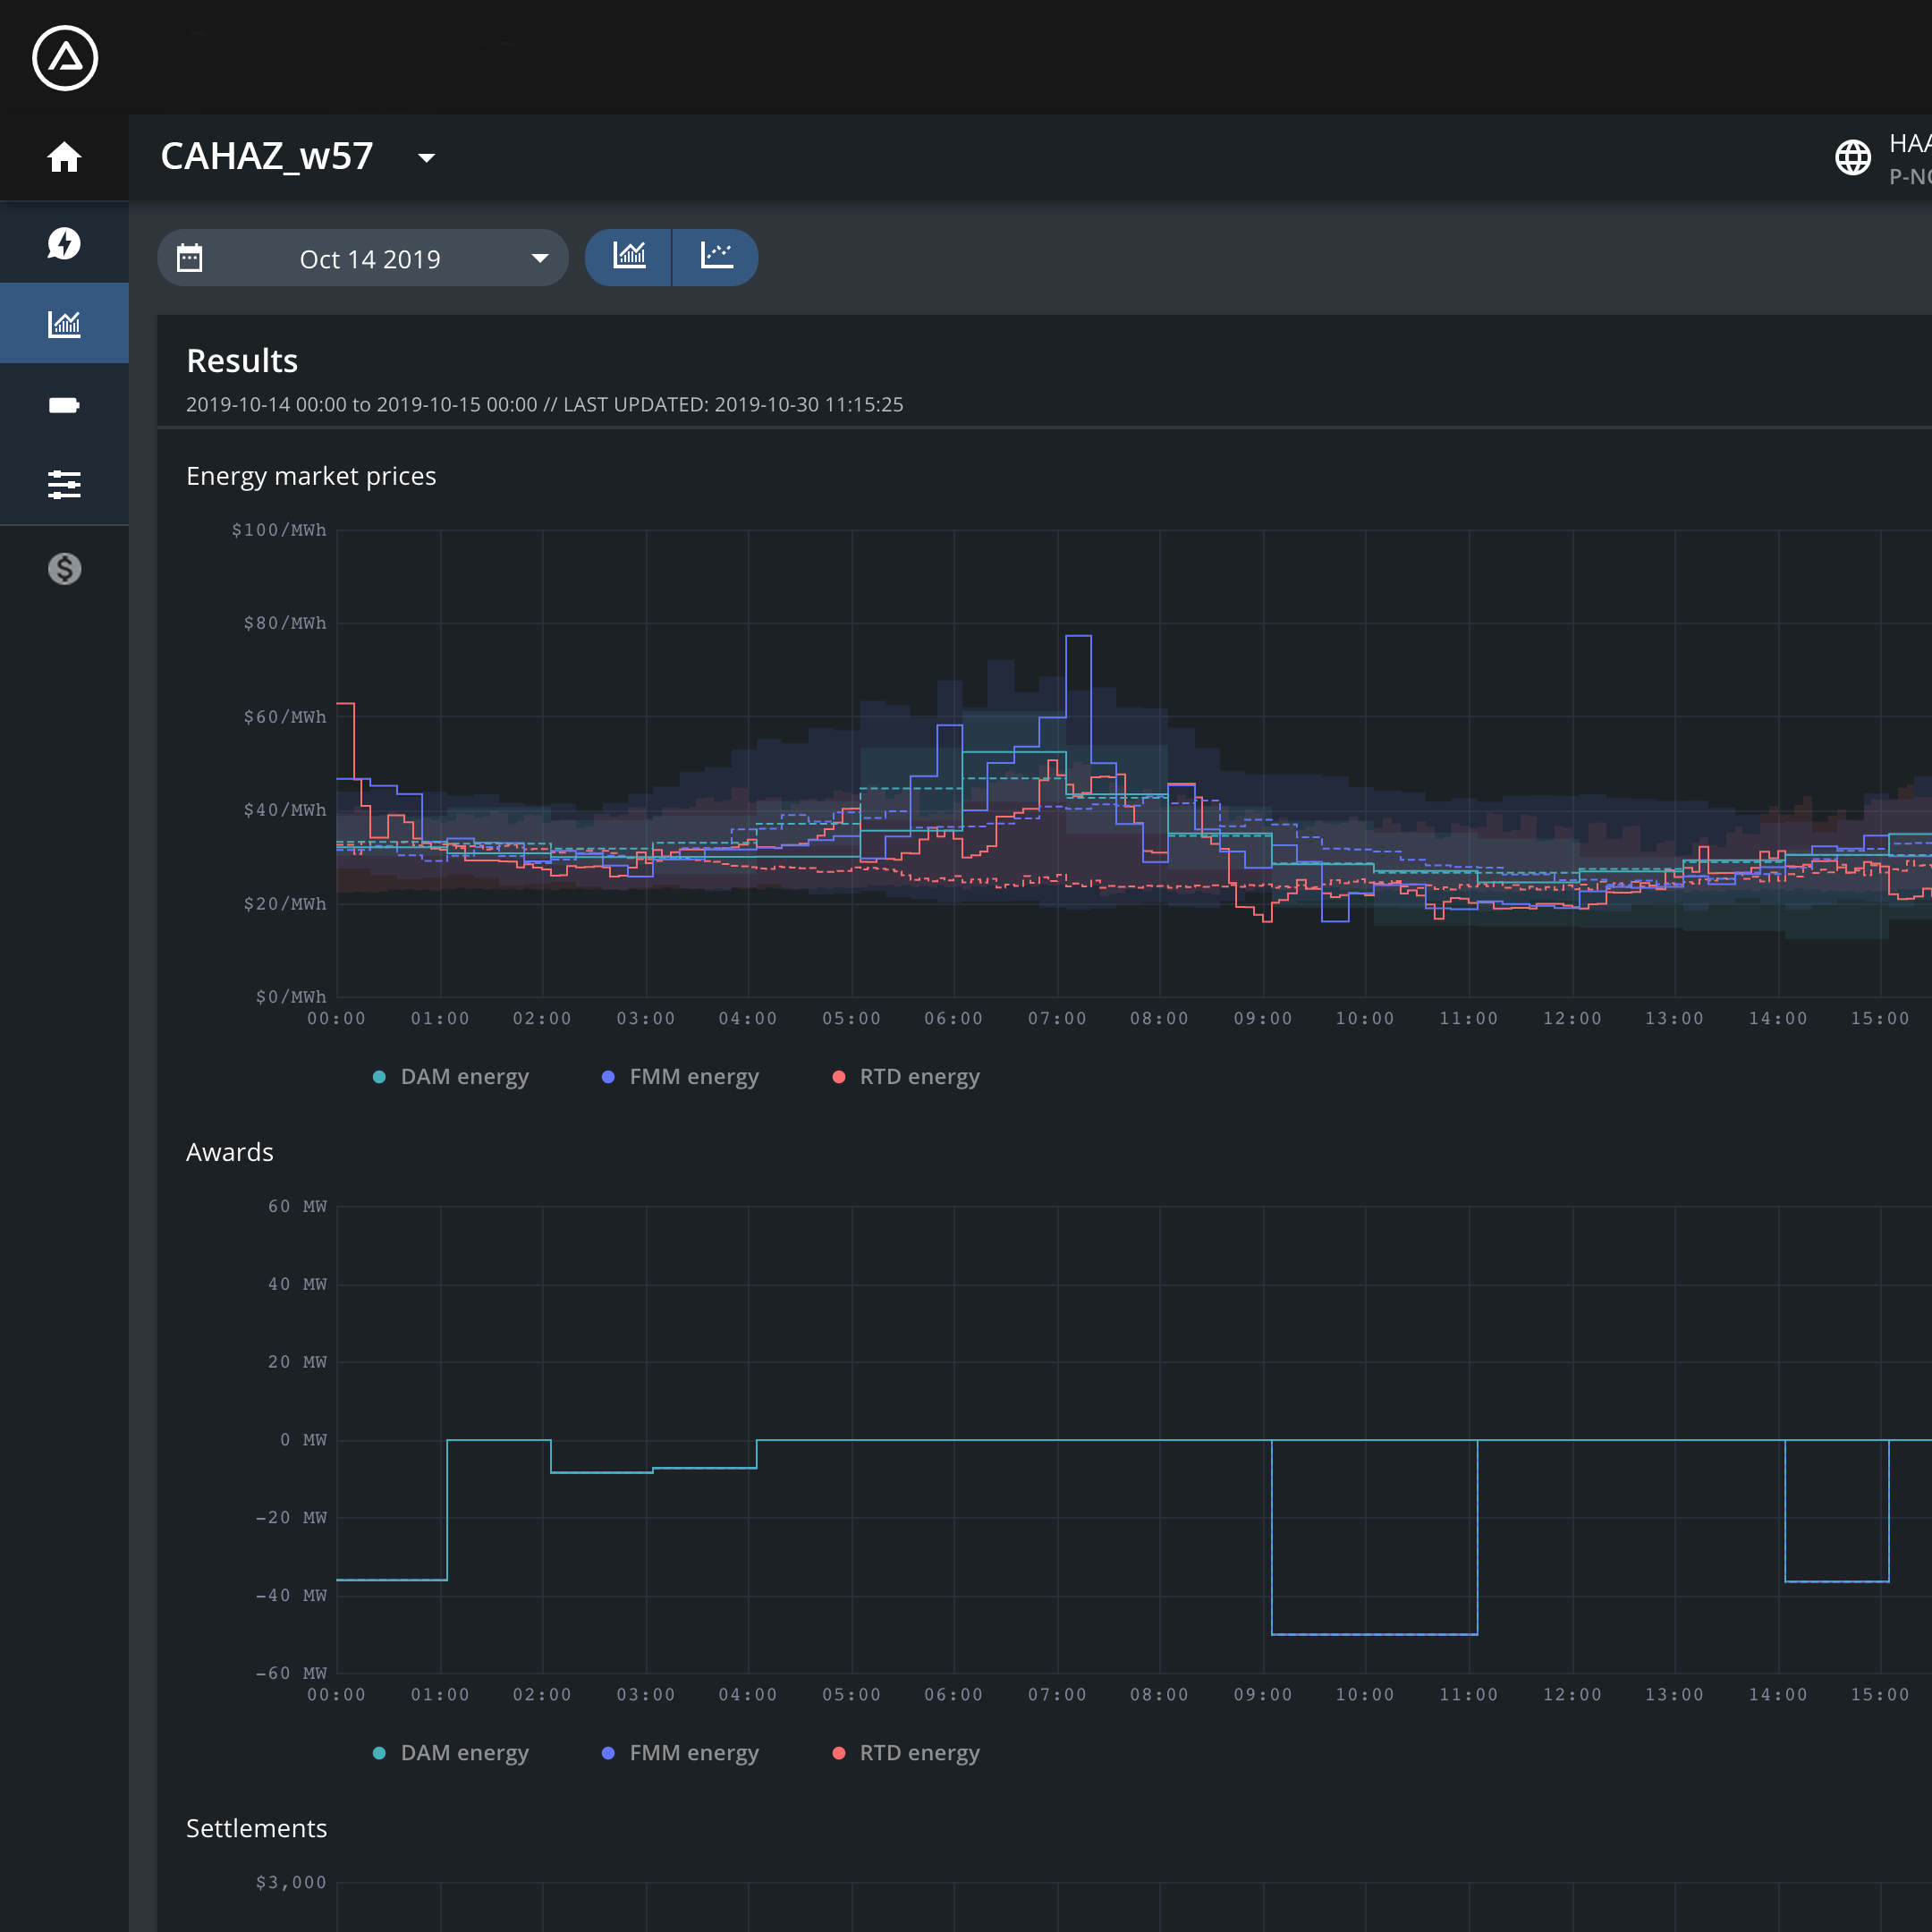
A robust revenue uplift analysis should facilitate diving further into market price and award data at the hourly level. For example, Figure 1 below shows asset owners how the battery is co-optimizing across market products while managing state of energy throughout the day with respect to market prices. This level of detail exposes the specific market conditions and bidding decisions that contribute to a divergence in revenue between the algorithmic and manual strategies. A complete analysis shows owners their asset’s expected operational revenue using an algorithmic bidding strategy and validates the decision to adopt an algorithmic approach.
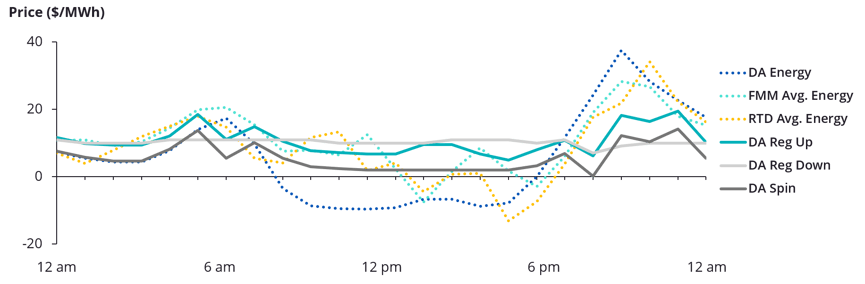
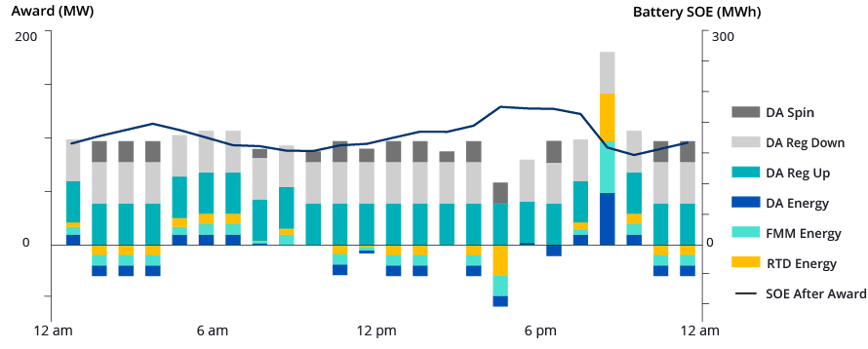
Figure 1: Example analysis performed with actual Day Ahead Market, Fifteen Minute Market, and Real Time Dispatch prices for May 28, 2019 at HAAS_7_B11 price node and NP-15 AS trading zone; 50MW/200MWh; 1 cycle / day limit; 93% charge efficiency and 95% discharge efficiency; regulation up & down cap of 50 MW
Percent of Perfect Foresight (PoP)
In addition to understanding the value uplift of an algorithmic trading approach relative to a manual approach, asset owners increasingly require capabilities and metrics to evaluate the performance of various algorithmic bidding software platforms. Percent of Perfect Foresight, or PoP, analysis helps asset owners achieve this by evaluating the performance of a selected algorithmic trading approach. Specifically, PoP analysis compares revenue from an operational algorithmic trading approach with the maximum revenue that an asset could have attained if it had perfect knowledge of actual market prices (i.e., “perfect foresight”).
Like revenue uplift, PoP is calculated by comparing the revenues from two scenarios of a year-long backcast:
1. Operational Foresight Scenario: The algorithmic bidding solution with an operational forecast (i.e. making real-time trading decisions using AMS’s forecasted prices), and
2. Perfect Foresight Scenario: The algorithmic bidding solution with perfect foresight (i.e. making real-time trading decisions using actual prices).
PoP equals the Operational Foresight Scenario revenue as a percent of Perfect Foresight Scenario revenue. This measurement demonstrates the algorithmic trading approach’s ability to capture the total potential market revenue. A complete PoP analysis also includes hourly bids and market awards that can be evaluated across the scenarios, providing context for the results.
There are two main differences between the operational foresight and perfect foresight scenarios: 1) the forecast itself, and 2) the level of uncertainty that the optimization consumes. Because no operational forecast will perfectly predict future market prices, an insightful forecast should contain confidence intervals and probabilistic values. The confidence intervals help traders assess the uncertainty of an operational forecast, while the probabilistic values are consumed by the optimization and turned into a set of compelling bids. The resulting PoP metric therefore demonstrates the optimization’s ability to manage forecast uncertainty as well as measures the forecast’s accuracy.
With revenue uplift demonstrating the value of an algorithmic approach and PoP validating performance across software platforms, together these two metrics provide battery asset owners with a clear guide for evaluating algorithmic bidding solutions.
AMS Case Study
As a provider of algorithmic optimization software, AMS places great emphasis on its revenue uplift and PoP results. AMS’s recent analyses of a range of battery assets in California shows AMS revenue uplift to be 40-50% compared to a manual bidding strategy and PoP to be 80-95%, with variations driven by asset size and configuration, warranty constraints, and location (i.e., pricing node). Not only does this mean that a 40-50% revenue increase is attainable by employing an algorithmic bidding solution, but also that just 5 -20% of the theoretical maximum market revenue is left unaccounted for when using AMS’s powerful algorithmic trading platform. A visualization like the representative chart below in Figure 2 allows AMS customers to best understand the revenue uplift and PoP analyses results and recognize the revenue impacts across market products.
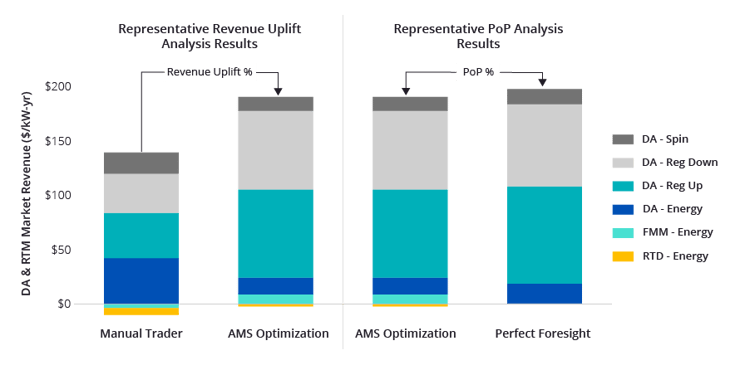
Figure 2: Example analysis performed with actual 2019 prices at HAAS_7_B11 price node and NP-15 AS trading zone; 50MW/200MWh; 1 cycle / day limit; 93% charge efficiency and 95% discharge efficiency; regulation up & down cap of 50 MW
The AMS team is constantly evaluating and improving our performance for our assets in the CAISO. For more information on AMS’s product, check out our CAISO product overview here. For additional questions or inquiries regarding site specific analysis of a CAISO storage asset, please contact trading@advmicrogrid.com.
AMS Experience
AMS is leading the clean energy revolution by maximizing the value of renewables and energy storage assets with its AI-powered software platform. AMS’s product offering equips battery owners and operators with the market information and tools needed to make real-time bidding decisions that maximize asset revenue, adhere to operational and business constraints, and comply with market rules. Built by a team with deep experience in California’s energy markets at utilities, battery manufacturers, and project developers, AMS’s CAISO platform translates the complexities of market rules into an optimization engine designed to ensure market compliance and value capture.
AMS designs products with the customer and the planet in mind. While enabling CAISO participants to make the most of their battery storage assets, the CAISO platform simultaneously supports grid flexibility and mitigates the negative grid impacts of renewable penetration through battery optimization. AMS has a proven track record of creating value for its customers. With over 1.5GW of live trading assets in the Australian National Energy Market, AMS has increased revenues for renewable assets by more than 10% during our 12 months of market operations. Learn more about AMS’s offerings and experience here.
AMS' Acquisition by Fluence
Fluence, a Siemens and AES company, has acquired the digital intelligence platform of AMS, the leading provider of AI-enabled optimized bidding software for utility-scale storage and generation assets. The combination of the two companies’ technologies will help utilities, developers, and commercial and industrial customers optimize energy storage and flexible assets to deliver additional revenue, improve grid reliability and efficiency, and support the global transition to more sustainable and resilient power systems. The AMS Trading Platform uses artificial intelligence, advanced price forecasting, portfolio optimization and market bidding to ensure energy storage and flexible generation assets are responding optimally to price signals sent by the market.
References
[1] AMS analysis of CAISO reporting
[2] CAISO uses the NGR model in order to bid both generation and load sides of battery energy storage systems as a single resource. For more information on CAISO’s NGR model, see section 2.1.13 of the Business Process Manual for Market Operations found here: https://bpmcm.caiso.com/Pages/BPMDetails.aspx?BPM=Market%20Operations
[3] A backcast is an analysis of what would have occurred over a historical period with known inputs, which in this case are actual energy and ancillary services prices.