

At the COP28 conference in Dubai, more than 130 national governments agreed to work together to triple the world’s installed renewable energy capacity by 2030. To meet these ambitious targets, renewable energy portfolios will scale in size and geographic breadth. This is an exciting time for owners and operators of renewables and storage assets. However, with any rapid growth, challenges may inevitably arise.
As an asset owner or operator, do you have a single source of truth on portfolio data for use across asset management, O&M, and financial teams? Even more, are you wondering how you can streamline your reporting process to create more efficient workflows and reduce variability from asset to asset?
We explore the challenges that relate to these questions in this final article of our 3-part series on asset management.
So far, we've examined the challenges of:
- Issue Identification and Prioritization, and Maintenance Planning
- Data Integration Across Asset Sources, Classes, and Technology Providers
In this third article, we will discuss Portfolio Visibility and Automated Reporting.
Siloed Visibility into Performance of Dispersed Assets & Portfolios
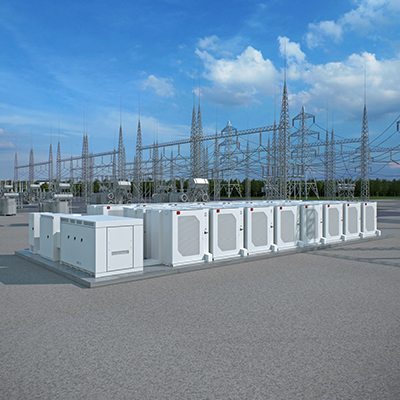
Companies that own and operate large-scale renewable assets know that access to timely, accurate, and reliable information about a portfolio’s performance is essential. As we covered in our last blog post, integrating data streams across assets with different SCADA systems, monitoring tools, and asset technologies remains a challenge. Without a single view covering all the assets, it might be difficult to effectively monitor and compare asset performance within a portfolio. And as companies expand their portfolios across countries and continents, this becomes even more challenging.
As an asset owner or operator, do you have a single source of truth of portfolio data that is gathered from across asset management, O&M, and financial teams?

Creating a Single Source of Truth Across Portfolios
When teams have one spot to go for performance data, it’s easier to see a holistic view of performance of portfolios across asset classes and OEM providers. It also helps to avoid data discrepancies between teams and the effort needed to resolve those differences. However, the tools currently available for this purpose lack real tangible experience in tracking various types of assets and offer limited configurability.
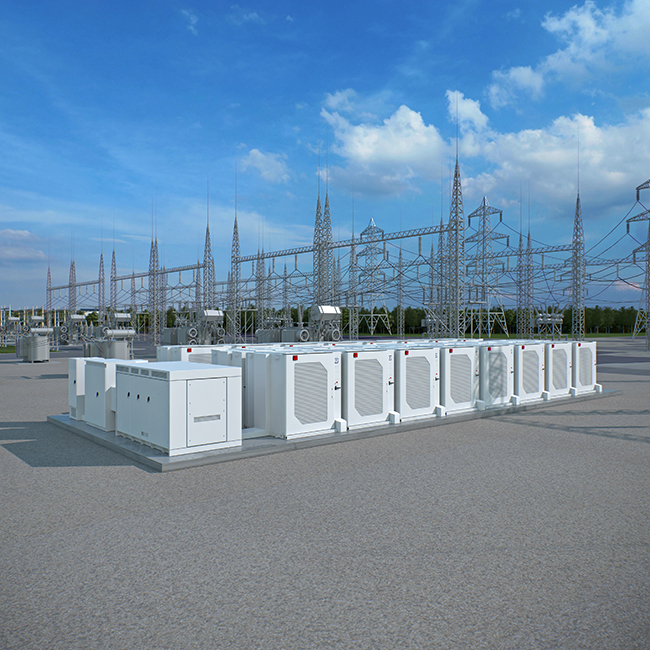
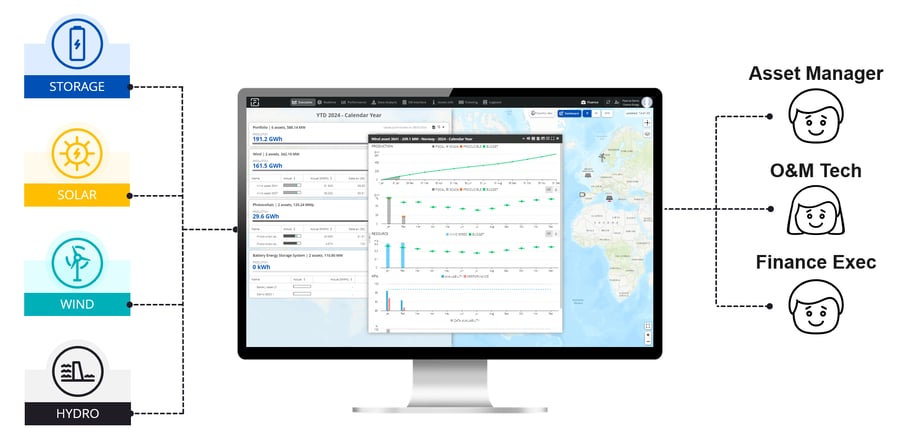
Fluence Nispera is the next generation of asset performance management software that creates a single source of truth of data of individual assets and portfolios across solar, wind, hydro, and energy storage assets from any technology provider and offers unparalleled configurability based on user needs.
Nispera scales with you as your team and your portfolio expands in terms of scale and geographical coverage, so you can focus on what matters most – safe, efficient asset operation.
Portfolio Visibility Across Asset Classes and OEM Technologies
Dashboards and analyses tailored towards specific end users
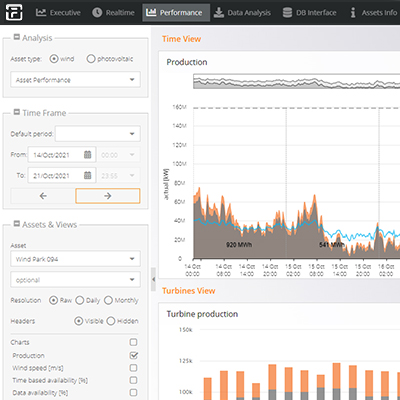
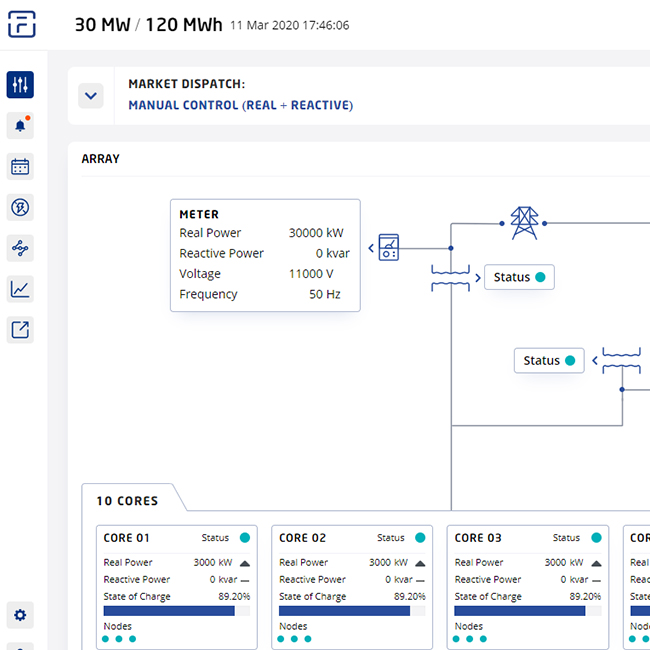
Nispera’s AI-powered interactive dashboards can easily be tailored towards different audiences with the ability to provide a high-level overview and drill down into daily, monthly, and yearly performance trends by filtering using user-specific metrics. With these dashboards, operations and maintenance technicians can go into the lowest level of detail, such as solar tracker positioning, inverter temperatures, or wind turbine alarms. Executives, on the other hand, can make informed strategic decisions based on insights into the portfolio’s operational and commercial performance over time.
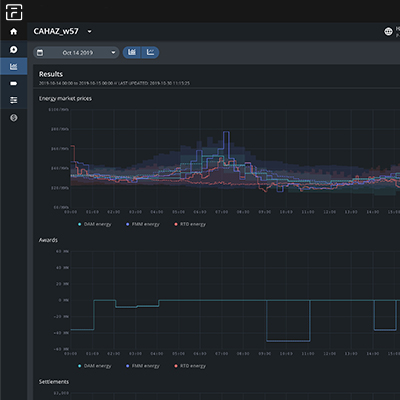
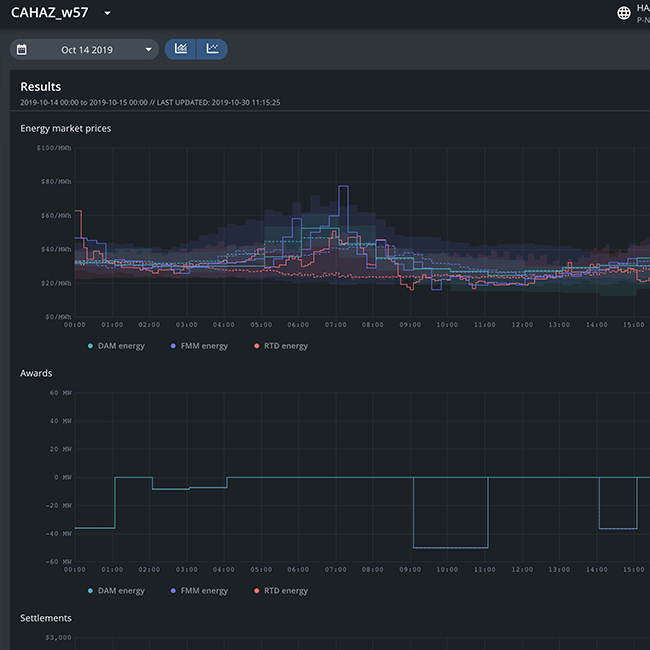
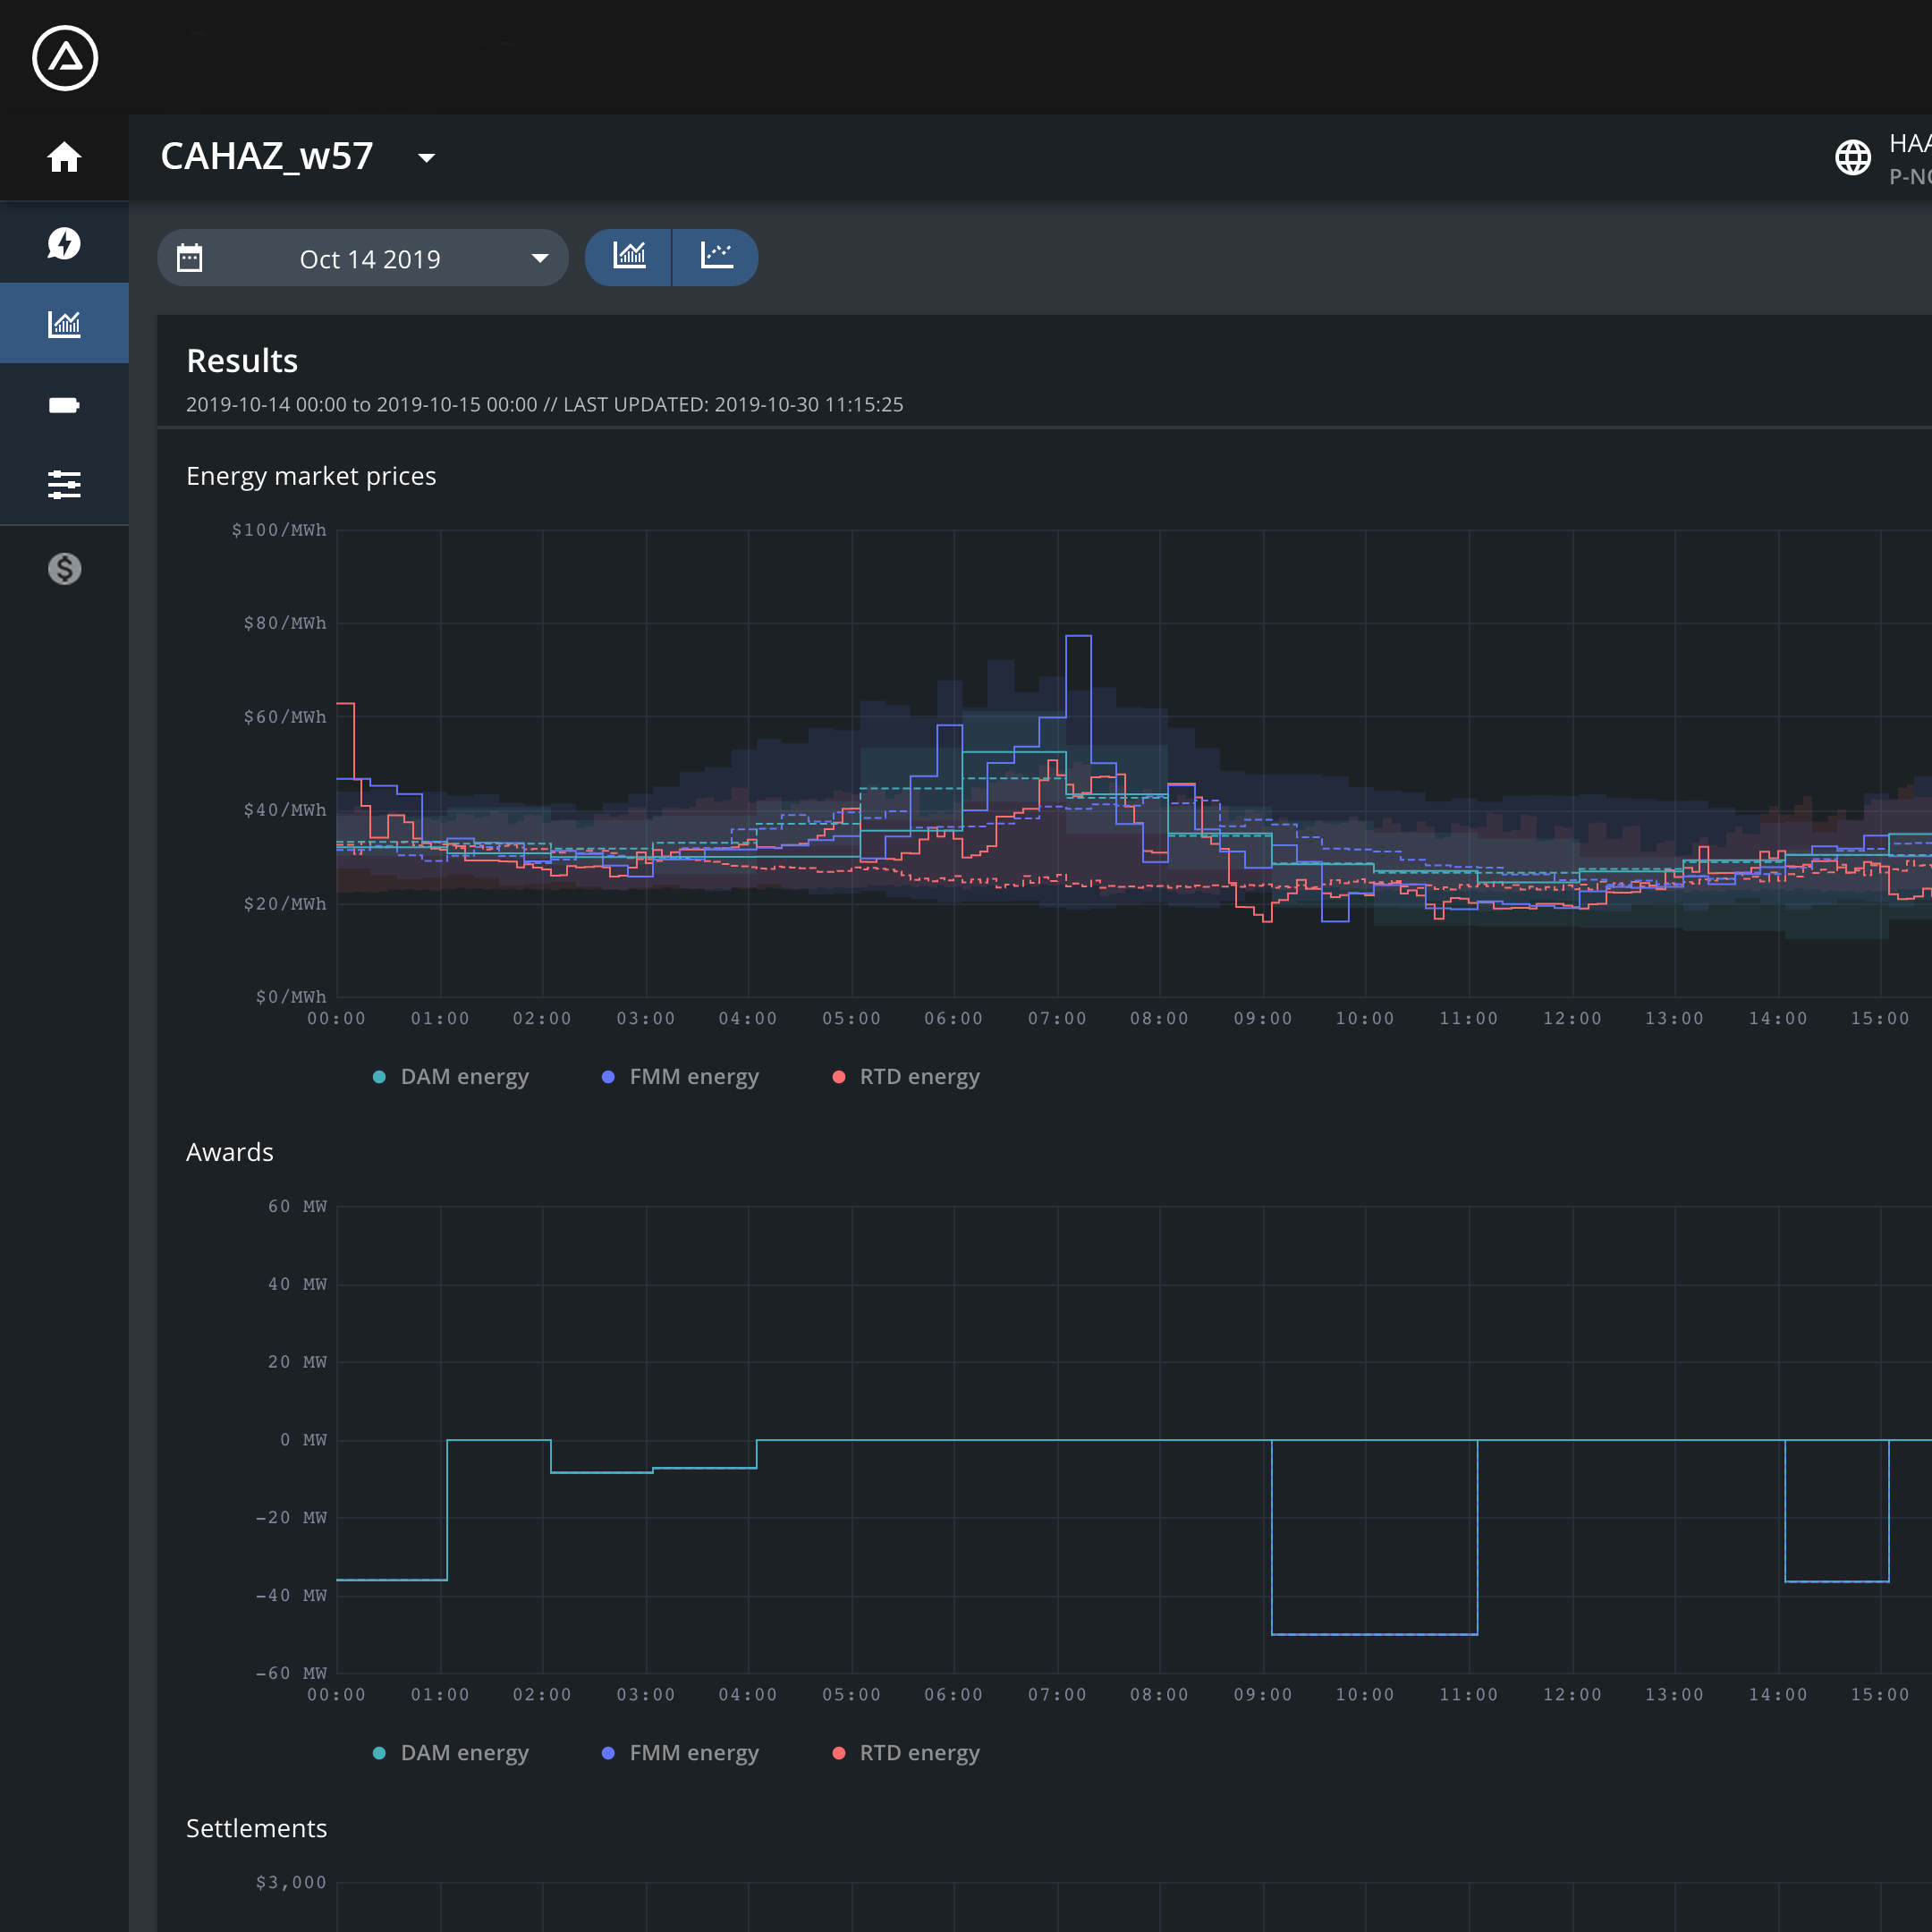
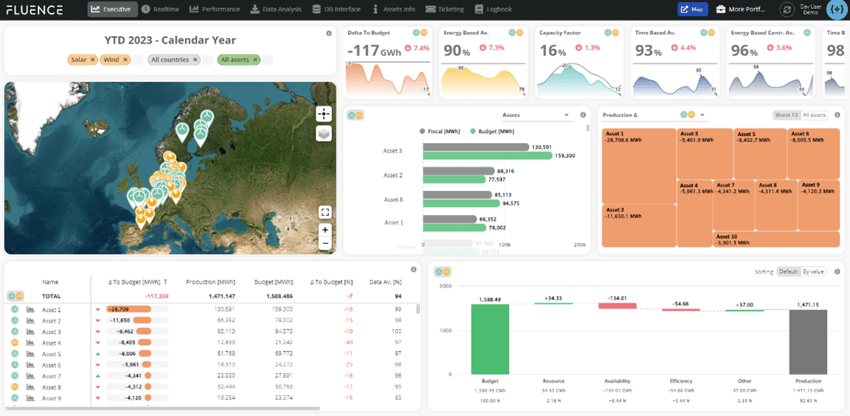
Various dashboard views allow users to identify a portfolio’s overall performance and biggest challenges (Executive Dashboard), see asset-specific real-time activity (Real-Time Dashboard), track performance against normal behavior (Performance Dashboard), and build their own analysis using dozens of variables (Data Analysis Dashboard). These analyses can be fine-tuned to the types of assets, location, technologies, desired time frame, and other needs with just a few clicks.
View of the Nispera’s Executive Dashboard
Challenges in Ad-hoc Reporting and Standardization Gaps
Generating regular reports and making decisions based on their findings is often stalled by the manual effort required. Lack of standardization across asset classes and inconsistent communication across teams makes it even harder. Asset managers and asset owners often spend countless hours harmonizing analyses and findings to meet the needs of various stakeholders. This could lead to the development of different report templates over time, all of which would need to be individually updated as requests come in from various stakeholders across O&M teams, executives, financial professionals, and investors.
While OEM systems may include basic levels of reporting, there are often nuances in analyses, presentation, and data visualization needed for communicating with these different stakeholders. “Out-of-the-box” reports are generally not customizable – what you see is what you get – leaving asset owners stuck with reporting templates that may not fit their needs.
Last, there is a lack of auditability when reports are generated on an ad-hoc basis using spreadsheets or inconsistently across assets and technologies.
Removing Roadblocks with Automated Reporting
Nispera’s AI-powered analytics and automated reporting enable more efficient, auditable analysis, report generation, and communication. Users no longer need to worry about where the data is coming from, who was processing the data, or if the spreadsheets and report templates are correct. After the initial setup with available SCADA signals, teams do not require manual effort to generate each report.
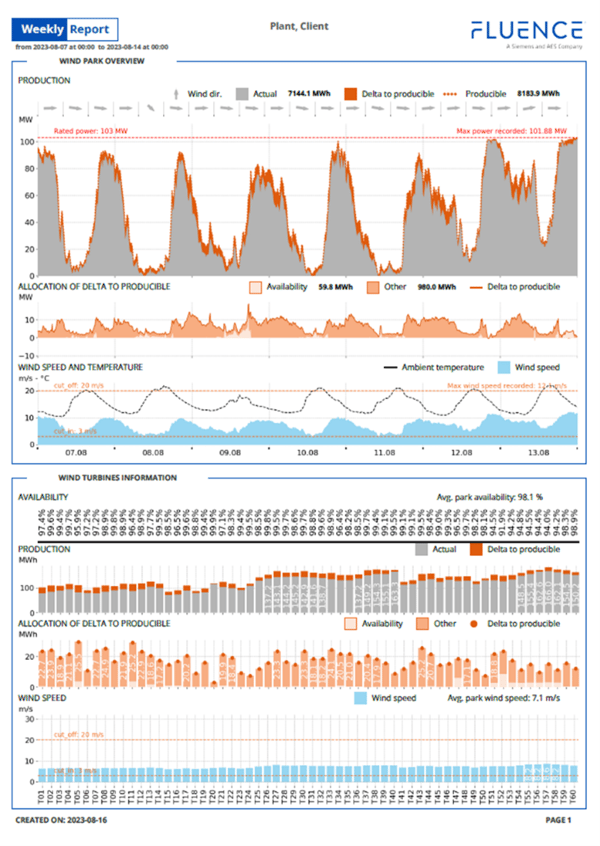
To meet the needs of various stakeholders, Nispera enables generation of daily, weekly, monthly, and annual reports on key technical and financial KPIs, including asset availability, production delta to budget, operating profiles, best and least performing assets and components. In turn, this enhanced communication can help improve alignment amongst teams and partners, support strategic portfolio planning, and drive down O&M costs by focusing daily maintenance activities on resolving the most impactful issues. Often, teams utilizing Nispera can accelerate portfolio growth without scaling the size of their team.
Sample Asset Performance Report for Wind Farm
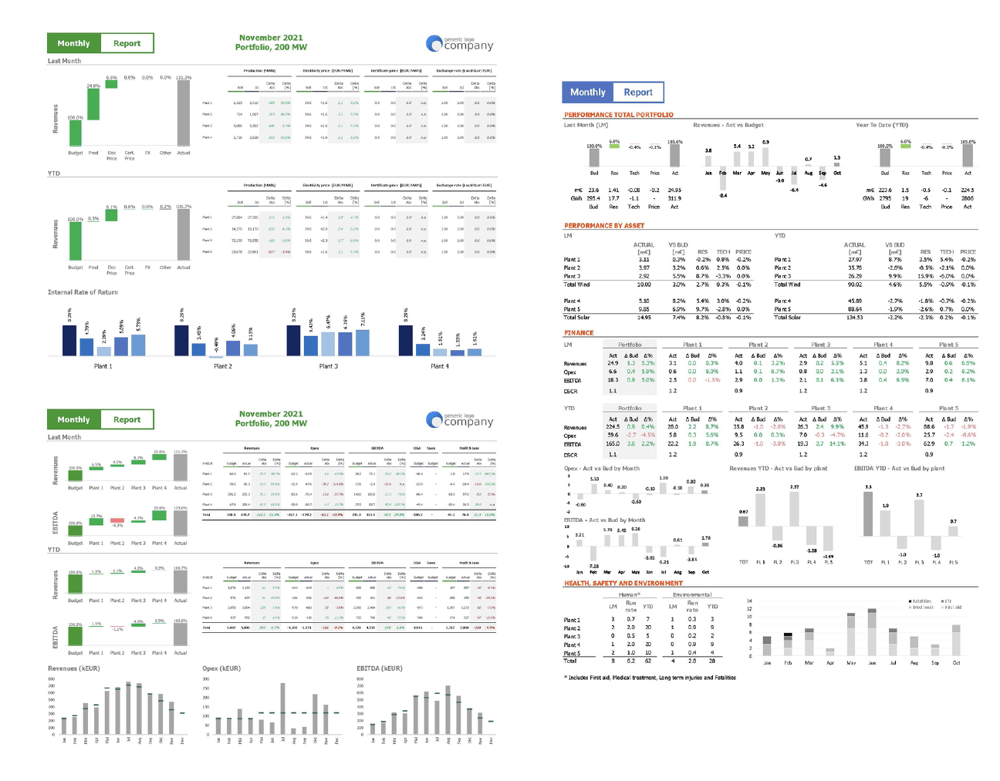
For example, finance or executive stakeholders may want to see technical performance and financial reporting on a monthly, quarterly, or annual basis at an asset, portfolio, technology, or country level. Nispera’s Executive Reports help identify where to make strategic improvements or investments by providing an overview of cumulative energy discharged, contract year-to-date performance, and delta to budget deviations of diversified renewable and energy storage asset portfolios.
Sample Executive Reports for Renewable Portfolio
Over this 3-part blog series, we introduced the top five challenges and best practices that asset managers face in tracking performance and prioritizing improvements. Here is a quick summary of what we have discussed:
- Utilize AI to help you analyze vast amounts of data to uncover anomalies that may be impossible for humans to catch.
- Plan your maintenance activities well in advance by leveraging power generation and market forecasts to minimize energy losses.
- Automate data integration, preparation, and harmonization so you can shift your attention to analysis and action.
- Integrate portfolio data into one central location accessible by all users with pre-built dashboards tailored towards different audiences.
- Generate automated reports from a single source of organizational truth that are flexible to meet the needs of various users.
By providing a centralized platform that collates and organizes data from various sources, you can empower asset managers and on-site technicians to spend more time on strategic actions like resolving performance issues, minimizing downtime, and maximizing energy production.
If you would like to learn more about these challenges and best practices, we would love to share how we are helping our partners find success in these areas.
Want to see Nispera’s capabilities in action?