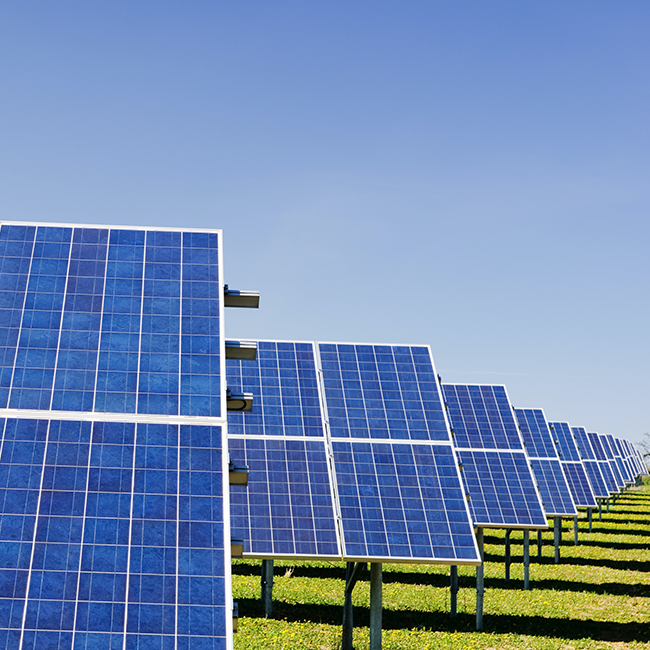
2018 is poised to be a record-breaking year for solar globally. GTM Research projects that solar PV installations in 2018 will be the same as all solar installations pre-2013 combined. Certainly, in the short to medium term, solar power has a strong outlook. In the long term, however, solar power’s outlook is not so clear. As solar PV penetration increases, the value of additional solar energy on the grid decreases due to falling capacity value. This has been shown by studies as well as empirical data from grids with large ‘duck curves’ like California which need to curtail solar when there is more solar generation than the grid can support.
Looking ahead, solar will be on a perpetual cost treadmill to make sure the cost of adding new solar remains below the declining value of additional solar on the grid. If the marginal value of one additional unit of solar falls below the marginal cost, it will be hard to justify additional solar investment. For society to capture the full benefits of solar energy, in both the short term and long term, we must find solutions to prevent solar value deflation caused by higher levels of solar penetration. In fact, solar installations in the US declined in 2017 for the first time, in part due to the declining value of additional solar energy.
It's happening faster than we think.
In 2013, the California Independent System Operator (CAISO) attempted to predict how the influx of renewables, particularly solar energy, would impact the grid overall. Their predictions are summarized in an infamous net load curve affectionately known as The Duck Curve (or The Duck Chart).
 Source: CAISO
The graph indicates that as solar resources are added to the grid, there is a risk of generating too much power during the daylight hours while not having enough to firm capacity as the sun sets for the needs of people as they return home, cook dinner, and use electronic devices. In 2013, CAISO estimated that by 2020 the grid would need to ramp 13,000 MW in three hours.
In the years since, California has demonstrated that the load and ramping demands for power are even higher and are occurring at a faster pace than was predicted in 2013. February 18, 2018 is a perfect example of how ramping and curtailment issues are already creating issues on electricity grids today.
 Source: CESA 2018 Market Development Forum
Due to inflexible generation that cannot ramp up or down quickly, CAISO had to curtail renewables while keeping traditional thermal generators online to meet the evening ramp. In total, CAISO curtailed approximately 13 GWhs of renewables over 10 daytime hours in order to meet the evening ramp and peak. This resulted in a net load (load minus solar and wind generation) of ~7,500 MW, which is approximately half of the minimum net load CAISO had predicted back in 2013.
February 18th illustrates how solar generation is a great carbon-free energy resource to offset fossil generation during the day, but that without mitigating the duck curve, any additional solar energy generated in these hours will be curtailed and will not contribute to emissions reductions.
So what can we do about it?
As solar becomes a bigger portion of energy generation, grid operators will need solar resources to provide more than just zero-marginal cost energy. Solar resources will need to provide firm, flexible energy commitments even when the sun goes down, as well as critical grid services like frequency regulation and spinning reserves to stabilize the grid.
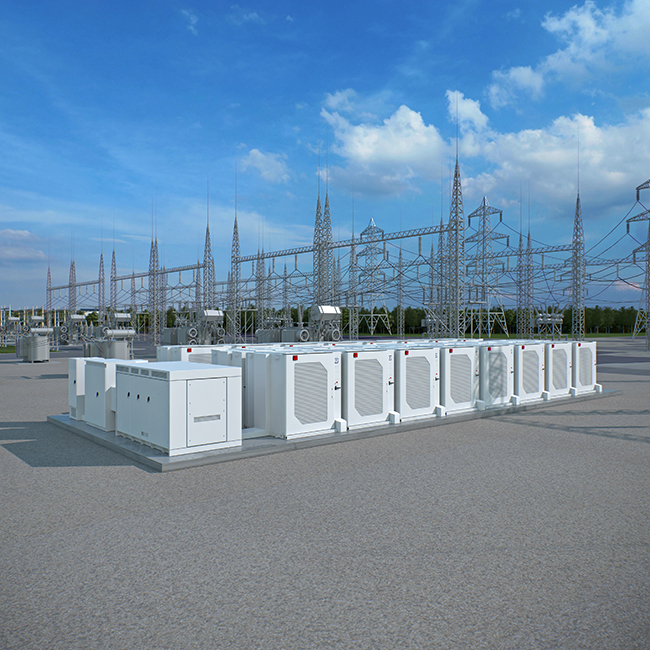
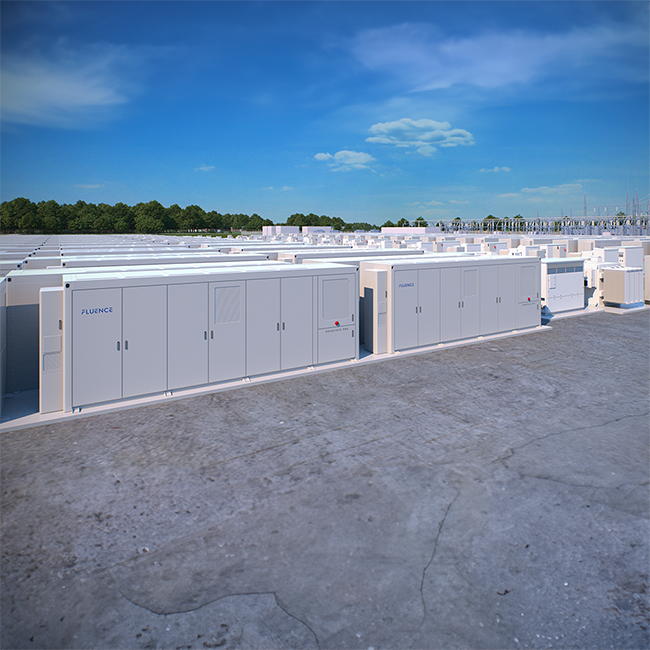
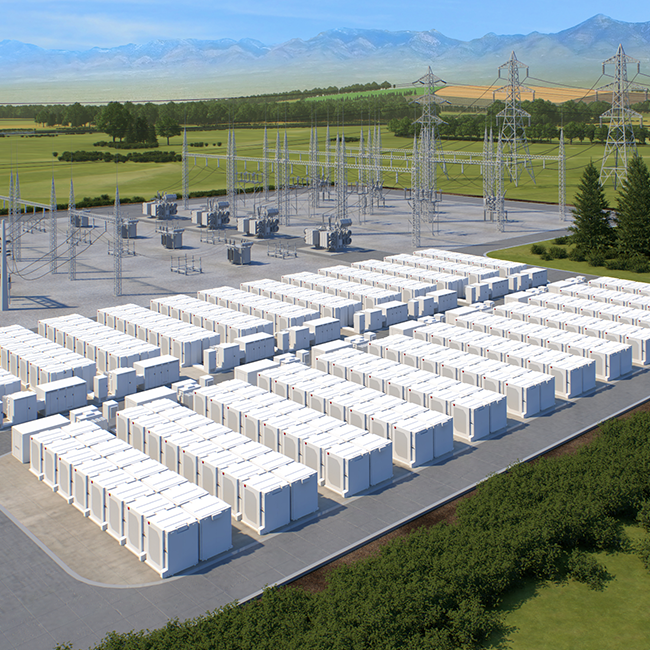
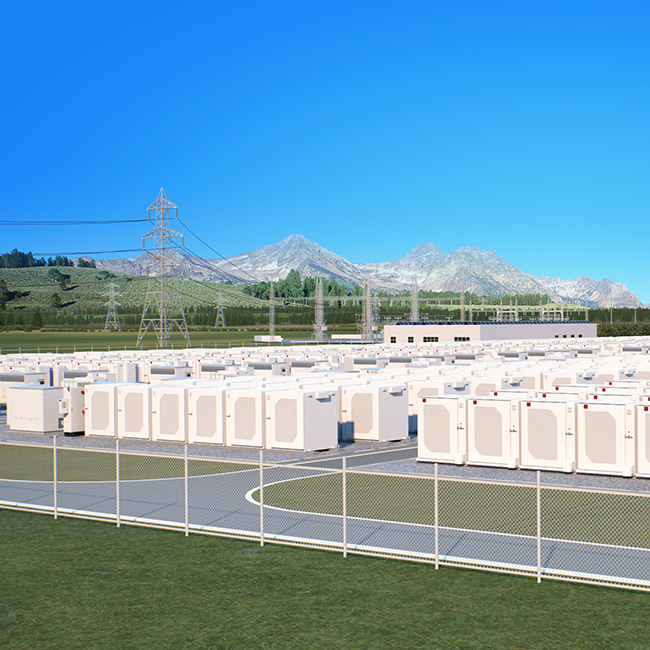
One solution to ensuring the long-term growth of solar is to deploy solar with storage either collocated or as standalone systems. Solar + storage provides flexible capacity by both absorbing over-generation midday and discharging it during the evening hours when carbon-free energy is needed. This allows grid operators to use a clean, carbon-free resource to provide enough capacity to serve their customers during peak demand periods rather than relying on traditional polluting fossil fuel plants.
In closing, there is an old debate on the Internet that asks whether you would rather fight 1 horse-sized duck or 100 duck-sized horses. Although we would have preferred 100 duck-sized horses, recent generation data from California shows that the CAISO is already fighting a horse-sized Duck Curve. We believe that solar + storage is a valuable tool to aid grid operators around the world in this fight and will ensure that the future of solar continues to be bright.

Up next
We hope that this blog post has been a good introduction into the reasons why combining solar + storage makes sense for the grid, solar developers, customers, and the environment. In future blog posts in this solar + storage series we will dive into more technical aspects of solar + storage such as:
- Part 2: AC vs. DC coupling for solar + energy storage projects
- Part 3: Webinar on Demand: Designing PV systems with energy storage
- Part 4: Considerations in determining the optimal storage-to-solar ratio
- Part 5: How to properly size the inverter loading ratio (panels, inverters, and storage) on DC-coupled solar + storage systems
Stay tuned!
